Image courtesy of Optimizely
Understanding how to run product experiments is a science. I've learnt from the school of hard knocks running them, and hope to share what I've learnt so that you know the basics and don't have to start from scratch.
It is advisable to work with a data scientist (or even better, have one embedded in your team) if you're thinking of running one. They can help you with experiment design and project your impact based on historical probability.
 Image courtesy of Pro School Online
Experimental results can be directional or statistically-significant.
Directional is when you want to validate a hypothesis, but don't need it to be mathematically-accurate and take into account false positives or negatives.
You may be seeing a direction of change, but it could be due to random chance, seasonality or skewed data based on how you run the experiment.
For the purpose of this blog, I'm talking about statistically-significant experiments.
2 questions to determine if you should run a statistically-significant experiment:
1) Is it a high-risk change?
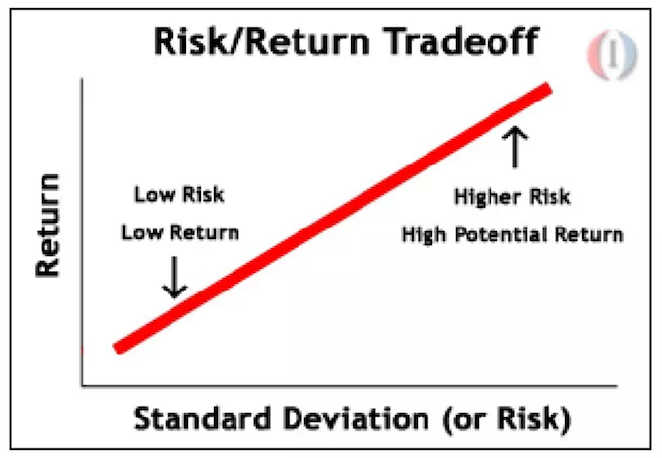 Image courtesy of Investopedia
The most common example is changing the onboarding flow for evaluators which impacts business revenue. The bigger the experience change, the bigger the risk.
The possibility of a positive impact may also be higher with a bigger change, as small cosmetic changes may not move the needle. If possible, push for a more daring change to overcome the local maxima problem.
You may have a degree of confidence in your new design based on qualitative research, but need bigger volume to validate your hypothesis as the small research sample size may not be representative of your customer base.
2) Do I have enough volume in my flow?
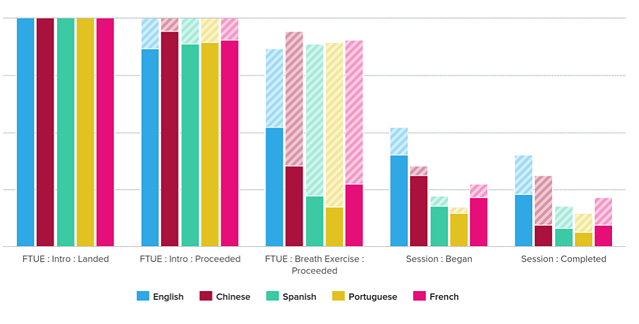 Image courtesy of Appcues
Running an experiment like this requires a pre-determined sample size based on the baseline conversion rate, as well as the degree of confidence (significance level) and precision required for the results. For smaller lifts or higher degrees of accuracy, a higher volume is required.
If the volume going through the flow where the change happens is very low, it may take months to run an experiment which is too costly. You might be better off validating your hypothesis using other methods.
Now that we know what type of experiment we are running, let's look at the basic phases of an experiment (excluding development).
Pre-analysis ⇒ Enrolment ⇒ Maturity ⇒ Post-analysis ⇒ Decision
1) Pre-analysis: Analysis of the expected impact, sample size required and expected run-time of the experiment.
2) Enrolment: Time period to gather the sample size required. If there are other experiments running during this enrolment phase that may impact your success metric,
there is an experiment clash.
You may want to negotiate with other experiment teams to wait for your experiment to finish first in order to prevent experiment pollution, assuming yours is of a higher business priority.
Feature-flagged progressive rollouts of new features will usually not clash with your experiment. However, if the rollout is very slow over a few months and the feature is likely to impact your success metric, you might want to mitigate the risk of experiment pollution.
You also want to run your experiment over any typical cycles of seasonality, i.e. by time of day or week.
- If you fill your volume on the first day, those users might not be representative of a full week's users.
- Data from public holidays may not be representative of typical customer behaviour.
Run longer is not necessarily better, running longer is better is a myth.
- Run for just enough time to fill sample size, otherwise p-value fluctuates after optimal period.
- If sample size goes infinitely large, we can pick up tiny differences, but this is a “p-value hack” (team is trying to manipulate results, run as long as possible to succeed).
- If run too long, other things might happen that impact results. When we just started the experiment and allocating variation vs control, their metrics are more likely to deviate and see a difference.
3) Maturity: Time period to get the results. For example, if you need to measure Week 4 retention, you need to add 4 weeks to the last day of your enrolment date to get results from everyone who enrolled in your cohort.
4) Post-analysis: Analysis of actual impact, based on your target population and removal of unreliable data (due to abnormalities, seasonalities etc.).
5) Decision: Before an experiment begins, a decision table for what you might do when encountering different results should be present.
This will reassure stakeholders that you have thought of the possibilities and that they agree with your next steps.
Before an experiment starts, the following experiment design decisions have to be made:
A) Hypothesis
We believe that change X (experience change) will result in an increase / decrease / no difference in Y (success metric) because of Z (e.g. belief, supporting research).
 Image courtesy of Alexander Cowan
If there are multiple hypotheses, then you need to reduce your α *.
B) Target population
You should choose a target population that is most likely to be positively-impacted by the change.
 Image courtesy of Elite Institute
This target population should ideally:
- Exclude users who may behave differently from your main target audience. If you want to include them, you may need to enrol longer to get the benefits of randomisation.
- Be used for the calculation of your baseline conversion rate, which is used to calculate the expected runtime.
- Be filtered through feature flags, so you won't have skewed distribution of your target population in cohorts.
C) Type of test
** A/A test: Make sure that the funnel can be depended upon by testing 2 cohorts of the exact same experience against each other, validating that there won't be a difference.
 Image courtesy of Analytics Toolkit
If the cohorts enrolled are fundamentally different without an experience change in the A/A test, your results will be inaccurate when running the A/B test.
You are testing the experimental framework to make sure that any problems are rectified before your A/B test. You can also use it to measure the baseline conversion rate.
** Is it a traditional A/B test or multi-variant test? A multi-variant is when you're comparing 2 or more variants against a control. If you're running a multi-variant test, you will require a longer run-time and higher accuracy.
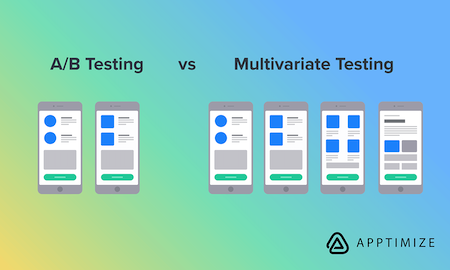 Image courtesy of Apptimize
Since there are more cohorts for multi-variants, you need to reduce your α *.
** Is it a one-tailed or two-tailed t-test? The more common type is a one-tailed t-test. If we choose one-tailed, we are testing for the possibility of the relationship in one direction only (e.g. positive only).
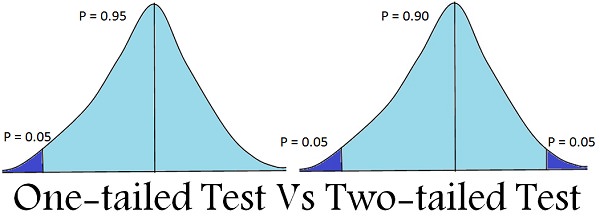 Image courtesy of Key Differences
The significance level of 95% will allocate our α to testing statistical significance in one direction of interest.
We may also consider a
two-tailed t-test, if we think that testing in the other direction (negative) is also important.
This is when we want to know if there is any possible significant regression, such as in situations where a regression may cause evaluator churn.
For a two-tailed test, you need to reduce your α *.
** Is it a test of proportions or means? If your metric is something like the % of MAU retained, it would make sense to use proportions as it is a proportion in and of itself.
If your metric is testing something like the average revenue per user, it would make sense to use a test of means. Instead of looking at whether something is qualified over the population, look at the average over a certain period of time intervals. E.g. daily averages of success metric of variation vs control.
How many daily averages do we need to reach stat sig? Look at historical standard deviations of daily averages, and use a reasonable confidence interval (95 or 99%). For a test of means, if the standard deviations during the experiment runtime is lower than the historical standard deviations, it would take faster to reach statistical significance.
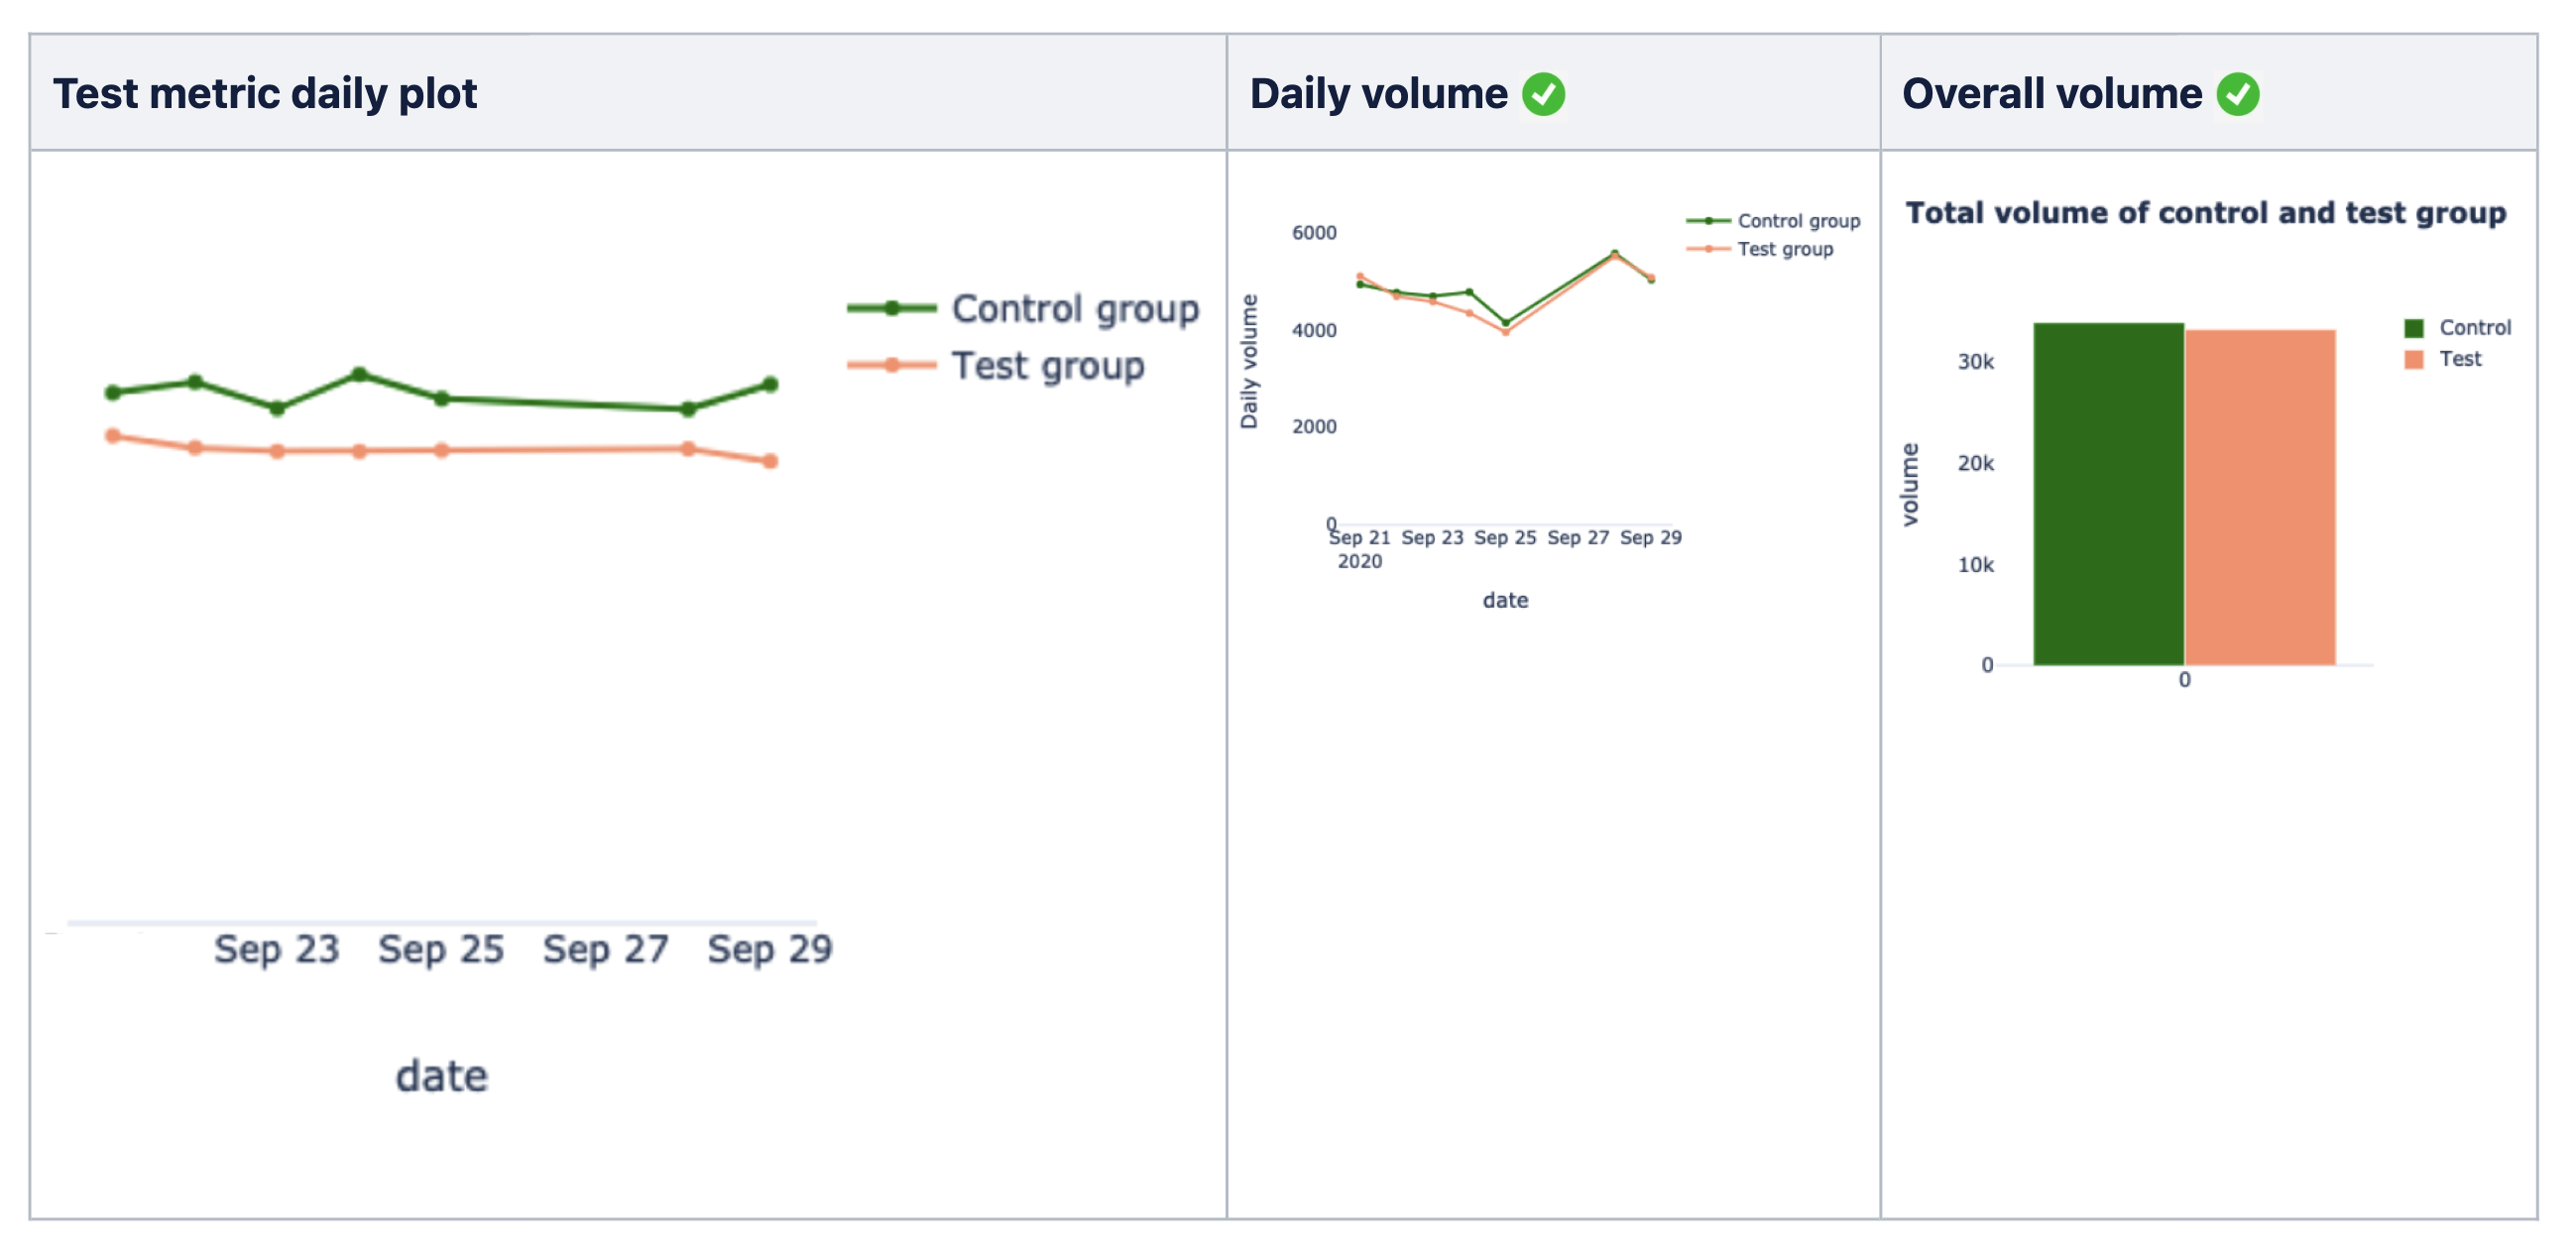
- Visually, the daily chart should show that the daily averages for the variation cohort are consistently better than the control cohort.
- In terms of volume, both daily and overall volume of the variation and control cohorts should be fairly similar to show that there is no large uneven data distribution.
Test of means vs proportions:
- Similarities: Both test of proportions and test of means need expected uplifts, historical baseline averages and required sample size.
- Differences: A test of means needs standard deviations, and looking at averages over time period.
** Do we need a permutation test? Unlike the traditional t-test which has an assumption of the sample distribution, the permutation test is able to work out the exact empirical sample distribution.
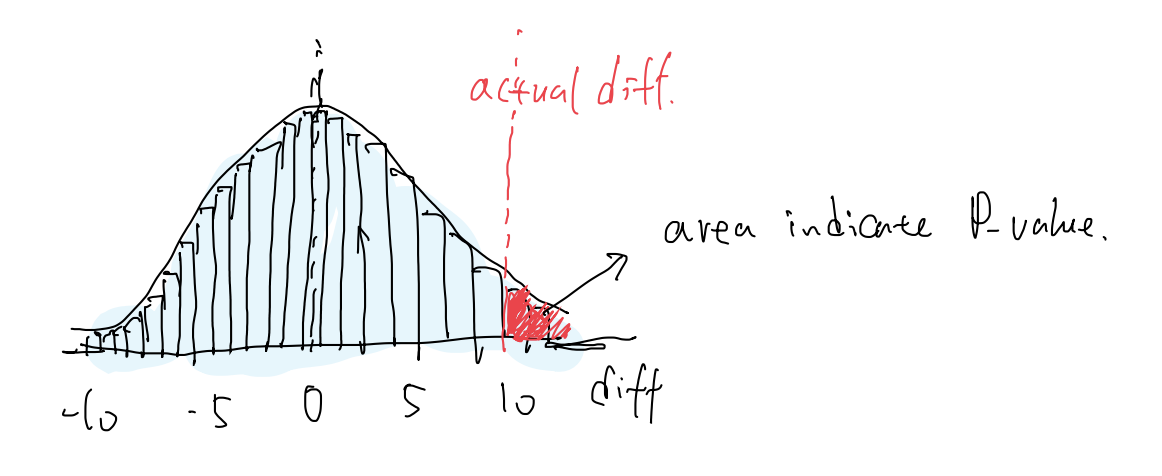
With permutation tests, we are able to find out:
- Empirical sample distribution (light blue shaded area)
- Observed difference (red dotted line)
- Area of probability it represents (red shaded area)
We want to see this observed difference (red dotted line) as far away from the centre as possible (left or right).
- The further away from the centre, the less likely that the difference is by chance.
- We want this red shaded area to be as tiny as possible.
- This red shaded area is actually our empirical p-value. For a 95% confidence level, we want this area < 5%.
Unfortunately, a lot of statistical tests require complex assumptions and convulated formulas. The permutation test is an awesome nonparametric brute-force test that is light on assumptions, and usable when what we want to measure (e.g. 90th percentile) don't really have a statistical formula that we can use.
- It does not assume that the distribution is a normal distribution with a bell-shaped curve.
- In the event where the data points do not map 1-1 to the way the experiment units are assigned (e.g. variation and control is assigned at the user-level, but data points are tracked per load per user), we can find out the significance level in a more robust way.
- If some users are loading a lot more than other users and skewing the results of the entire population, we'll have a more robust p-value as it should be able to handle some degree of imbalance.
- It won't change the observed results, but it will tell us if the observed result can be depended on via a more dependable p-value.
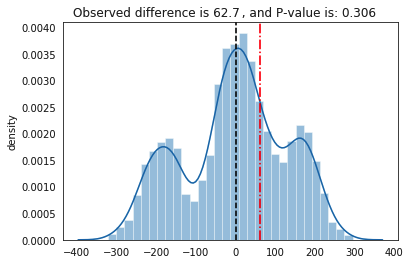
- It will also tell us if we need more rounds of permutation or a larger sample size, in the event that we don't get a bell-shaped normal distribution like in the image below.
How permutation test works:
- Each experiment unit has the chance of getting the variation and control labels when shuffled randomly.
- After a sufficient number of permutations, we create the approximate test statistic distribution.
- This distribution approximates all possible test statistic values seen under the null hypothesis.
- We then use this distribution to obtain probabilities associated with different mean-difference values.
- This visualization is a good explanation of how it works.
D) Success metric
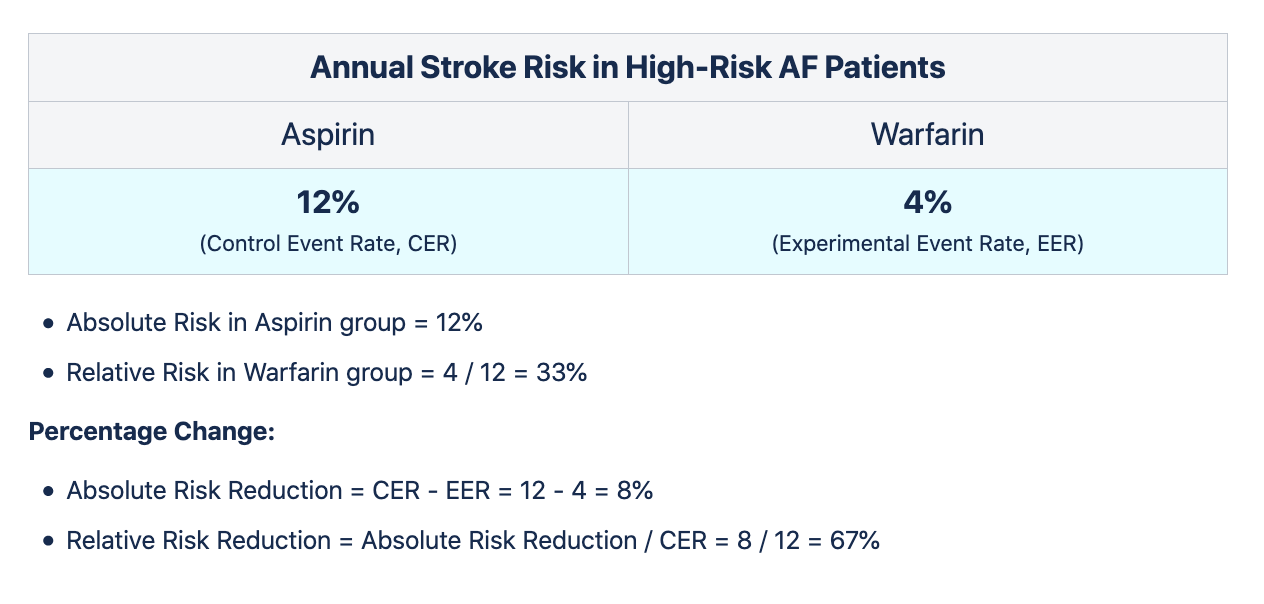
Measure of success refers to the relative (or absolute) change in the success metric.
Make it obvious whether it is relative or absolute when explaining to stakeholders, as people usually think in absolute terms. You won't want to mislead them to think that your impact is higher than interpreted.
If there are multiple success metrics, you need to reduce your α *.
E) Test parameters
We assume a normal data distribution with the standard 95% confidence and 80% precision for our results.
 Image courtesy of Research Gate
In inferential statistics, the null hypothesis's default position is that there is no statistically-significant difference between two variables (variation and control experience).
We want to correctly accept it 95% of the time (5% chance of false positives) when there is no actual difference, and correctly reject it 80% of the time (20% chance of false negatives) when there is an actual difference.
Our alternative hypothesis is the one which we think that there is an actual improvement based on our change. We want to reject the null hypothesis for the alternative hypothesis.
95% confidence: 1 - α
Significance level α = 0.05 (5%). Significance level is the % of the time that the minimum effect size will be detected, assuming it doesn't exist.
p-value represents this, where α should usually be < 0.05 to be statistically-significant.
* If you got multiple hypotheses, multiple success metrics or a multi-variant test, then you need to reduce your α.
We usually want to be 95% confident to NOT DETECT the minimum effect size when it doesn't exist.
In this case, we don't want false positives.
80% precision: Statistical power 1−β
Statistical power 1−β = 0.8 (80%). Statistical power is the % of the time that the minimum effect size will be detected, assuming it exists.
We usually want to be 80% likely to DETECT the minimum effect size when it exists.
In this case, we don't want false negatives.
F) Sample size required (per cohort)
Assuming that we have 2 cohorts in a traditional A/B test, we need to calculate the sample size for each cohort to detect the relative lift in the variation cohort when compared to control.
Resources that may help with estimating it are:
G) Estimated run-time
Assuming you have a baseline conversion rate of an expected weekly volume of users going through your funnel based on your target population, you need ~X weeks to enrol the sample size and ~Y weeks to get to maturity.
When you start the experiment, you have to monitor the volume of enrolment as it might differ from estimates.
It is advisable not to engage in peeking of results before the experiment reaches maturity, as it might mislead you to make the wrong conclusions.
However, you can do that if you're running a sequential sampling test which allows real-time decision making.
Epilogue
Statistically-significant experiments take time to set up, design and run. Many startup founders grow their companies successfully without doing them.
On the other hand, as a company scales to millions of users, experimental infrastructure is created to allow product teams to validate ideas quickly to benefit from the volume and more importantly, understand the impact of their rollouts on business metrics such as revenue and retention.
As we move into the age of machine learning and big data, experimentation frameworks may change with the assistance of computing intelligence. How that changes the way we run experiments is an exciting development that will be worth watching out for!